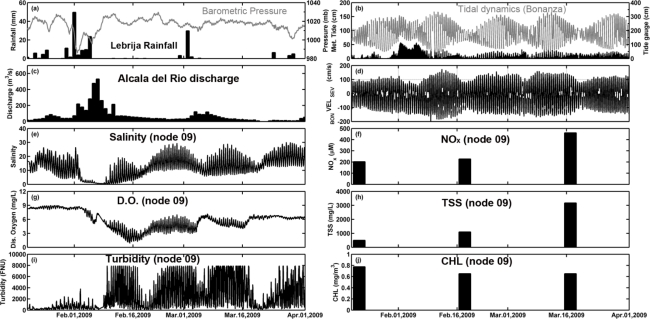
Figure 9.
(a) Daily rainfall (black bar) registered by the meteorological station located in Lebrija and atmospheric pressure (grey line) recorded at the meteorological node; (b) Meteorological gauge (black bar) and tide gauge (grey line) measured at Bonanza; (c) Daily average river discharge from the Alcalá del Río dam; (d) Water current velocity measured by the hydrodynamic node at 1-m depth (negative, downstream current in the estuary). Real-time remote monitoring data observation at node 09 of salinity (e), dissolved oxygen (g) and turbidity (i). Temporal distributions of NOx, total suspended solids and chlorophyll distribution at node 09 (f, h and j, respectively).

