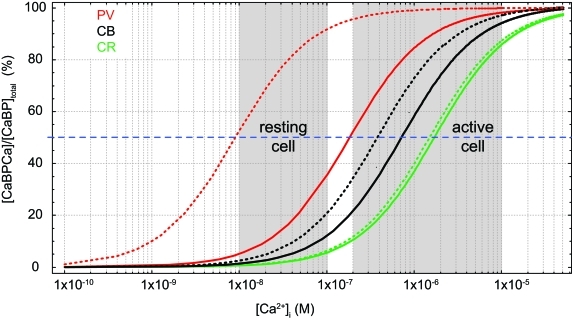
Figure 1.
Effects of Mg2+ on Ca2+ binding. Simulated steady-state Ca2+-binding curves of the Ca2+ binding proteins (CaBP) parvalbumin (PV, red, KD,Ca 9 nM, KD,Mg 31 μM), calbindin (CB, black, average KD,Ca 393 nM, KD,Mg 714 μM; cf. Table 1), and calretinin (CR, green, average KD,Ca 1.5 μM, KD,Mg 4.5 mM) in the absence of Mg2+ (dotted lines) and in the presence of 600 μM Mg2+ (solid lines).

