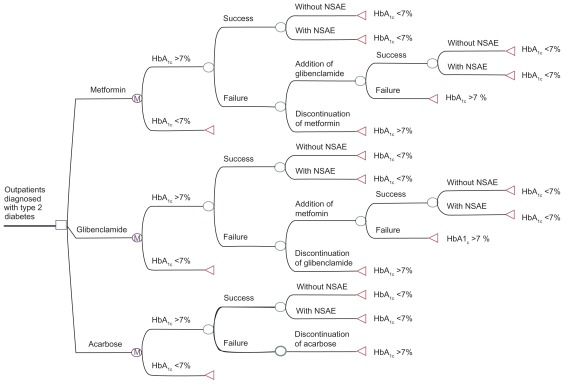
Figure 2.
Markov model as a decision tree designed using the TreeAge® program.
Notes: □ = the node of the decision to be made; Ⓜ = represents Markov nodes; ○ = random nodes (in the probabilities function); ◃ = branch end finished in a health state. The hypothetical patient cohort begins with the health state characterized by HbA1c > 7%.
Abbreviations: HbA1c, glycosylated hemoglobin factor; NSAE, nonserious adverse event.

