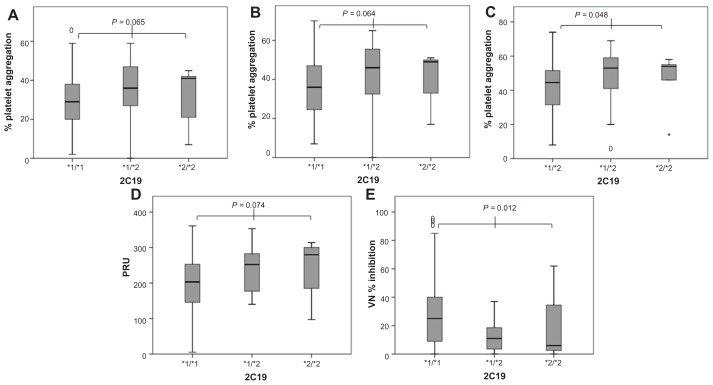
Figure 1.
Platelet aggregation represented as box plots and grouped according to cytochrome P450 2C19*2 genotype (*1/*1 [n = 107] vs *1/*2 [n = 39] vs *2/*2 [n = 5]). (A) Maximal platelet aggregation induced by adenosine diphosphate (ADP) 5 μmol/L (light transmittance aggregometry [LTA]); (B) maximal platelet aggregation induced by ADP 10 μmol/L (LTA); (C) maximal platelet aggregation induced by ADP 20 μmol/L (LTA); (D) VerifyNow® (VN) P2Y12 reactivity; (E) platelet inhibition measured by VN-P2Y12 assay.
Abbreviation: PRU, platelet reactivity units.

