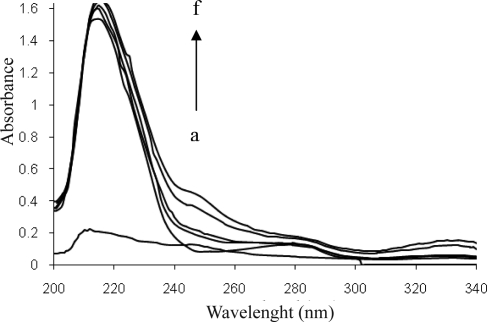
Figure 5.
Absorption spectra of erlotinib hydrochloride, BSA, and erlotinib hydrochloride-BSA complex (a→f). BSA concentration was at 2×10⁻⁶ mol l-1. Erlotinib hydrochloride concentrations in E=0.36, R=2 nm, and r=2.20 nm. The average erlotinib hydrochloride -BSA complex were 2, 4, 6 and 8 ×10⁻⁶ mol l−1.

