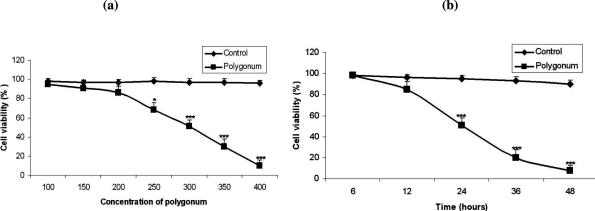
Figure 2.
a: Cytotoxic effects of Polygonum avicular at concentrations of 50, 100, 150, 200, 250, 300,350 and 400 ng/µl on MCF-7 cells versus control group (P<0.001), b: Cytotoxic effects of polygonum avicular at various concentrations of 50, 100, 150, 200, 250, 300,350 and 400 ng/µl on MCF-7 cells comparing to the control group following incubation for different time lengths (P<0.001).

