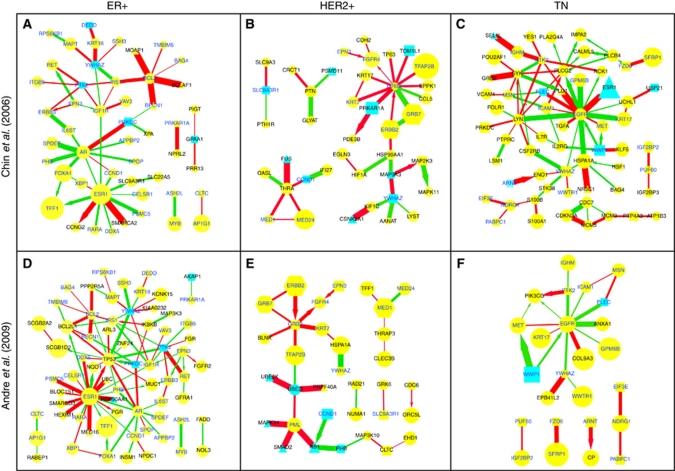
Figure 2.
Breast cancer subtype-specific (ER+: A and D, HER2+: B and E, TNBC: C and F) driver-networks in two separate data sets (Chin et al. (2009): A–C, Andre et al. (2006): D–F). The size of each node is proportional to the differential expression level of the corresponding gene. Yellow and blue nodes represent upregulation and downregulation, respectively, from gene expression data. The shapes indicate the type of genomic change, squares representing the seed genes with copy number alterations, circles representing differential expression without copy number alteration, hexagons representing both copy number and mRNA expression changes, and triangles representing inclusion based on differential co-expression without differential expression. Downregulated genes were included in the network either as seed genes (square nodes) or based on differential positive or negative co-expression (triangle nodes), as only significant overexpression was used for network expansion. The width and colour of an edge connecting two nodes reflect the magnitude and sign of the correlation (red: positive; green: negative) between two genes within the driver-network. An arrow pointing from one member gene to another indicates a transcriptional or signalling relationship, whereas lines represent PPIs. Genes common between the two driver-networks have blue font colour.

