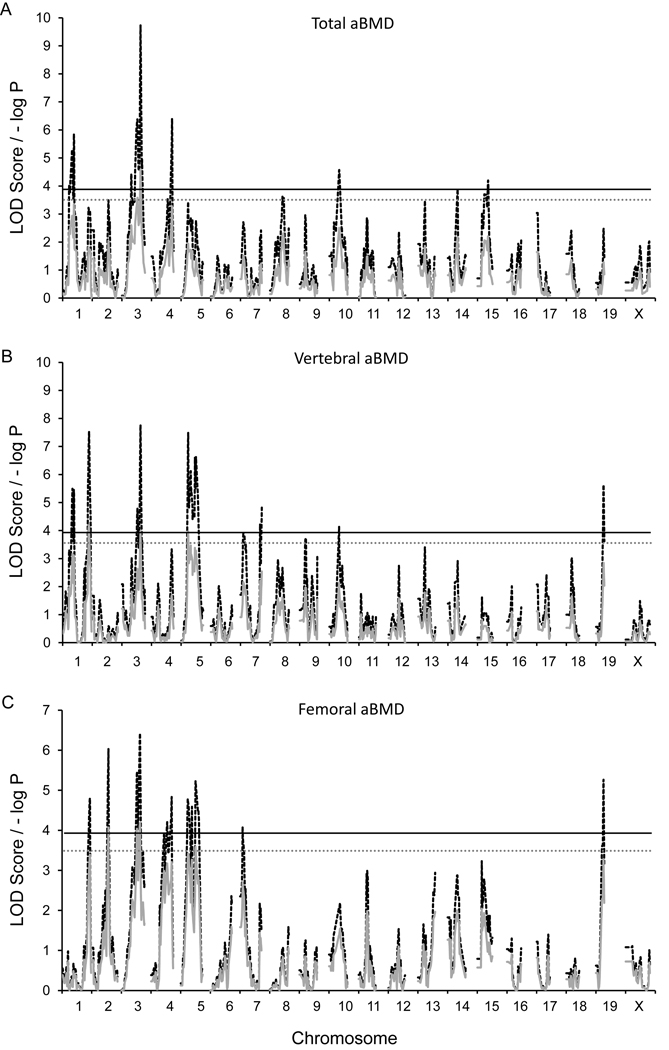
Figure 1.
G4 QTL maps of (A) total aBMD, (B) vertebral aBMD, and (C) femoral aBMD. Red traces are the simple mapping output, and black traces are GRAIP permutation output. For the GRAIP output, a minimum possible P value with 50,000 permutations is 0.00002 (1/50,000), so the maximum −log P = 4.7. The black and gray lines represent the permuted 95% (LOD≥3.9, P≤0.05) and 90% (LOD≥3.5, P≤0.1) LOD thresholds, respectively.

