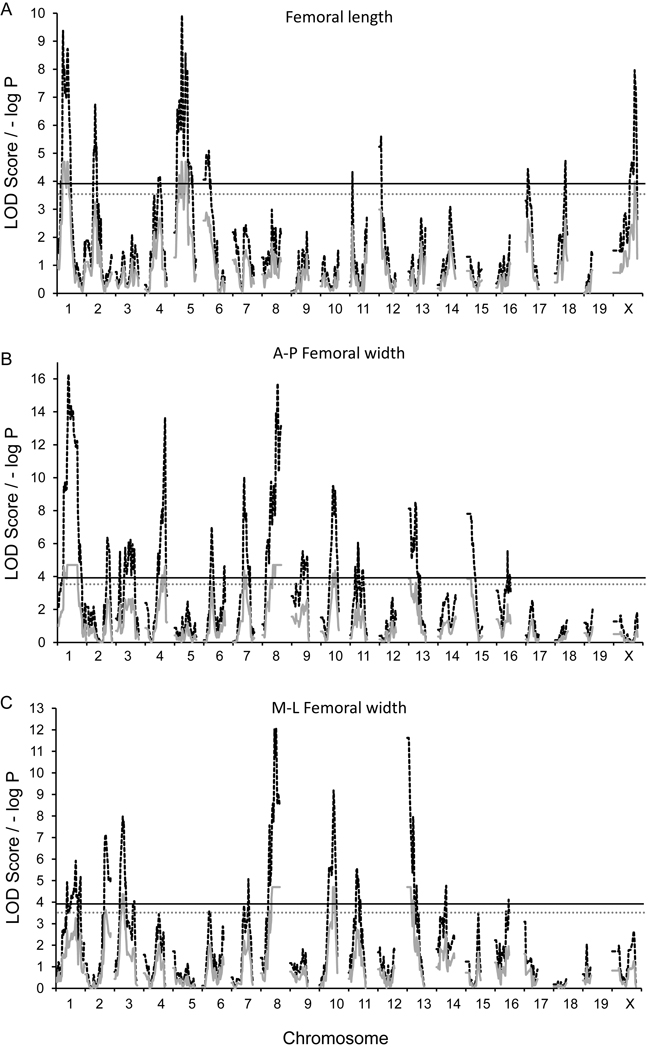
Figure 2.
G4 QTL maps of (A) femoral length (B) anterior-posterior femoral width, and (C) medial-lateral femoral width. Red traces are the simple mapping output, and black traces are GRAIP permutation output. For the GRAIP output, a minimum possible P value with 50,000 permutations is 0.00002 (1/50,000), so the maximum −log P = 4.7. The black and gray lines represent the permuted 95% (LOD≥3.9, P≤0.05) and 90% (LOD≥3.5, P≤0.1) LOD thresholds, respectively.

