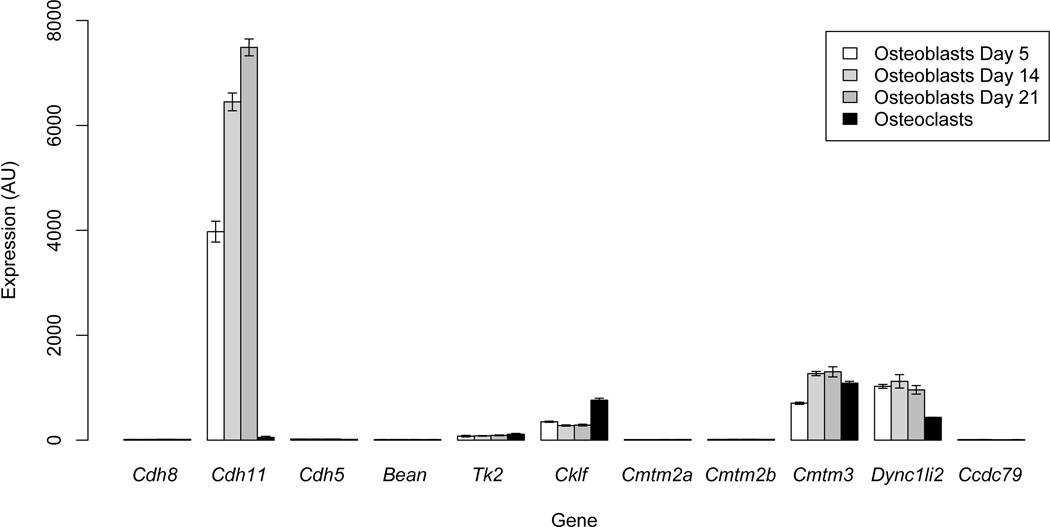
Figure 4.
Gene expression analysis for QTL genes in primary calvarial osteoblasts at 5, 14 and 21 days of differentiation and osteoclasts. The mean±sem of two microarray replicates per sample are plotted. Of the five genes that show detectable expression (Cdh11, Tk2, Cklf, Cmtm3 and Dync1li2) in osteoblasts, Cdh11 is the only gene that is statistically different (P<0.05) across the time course.

