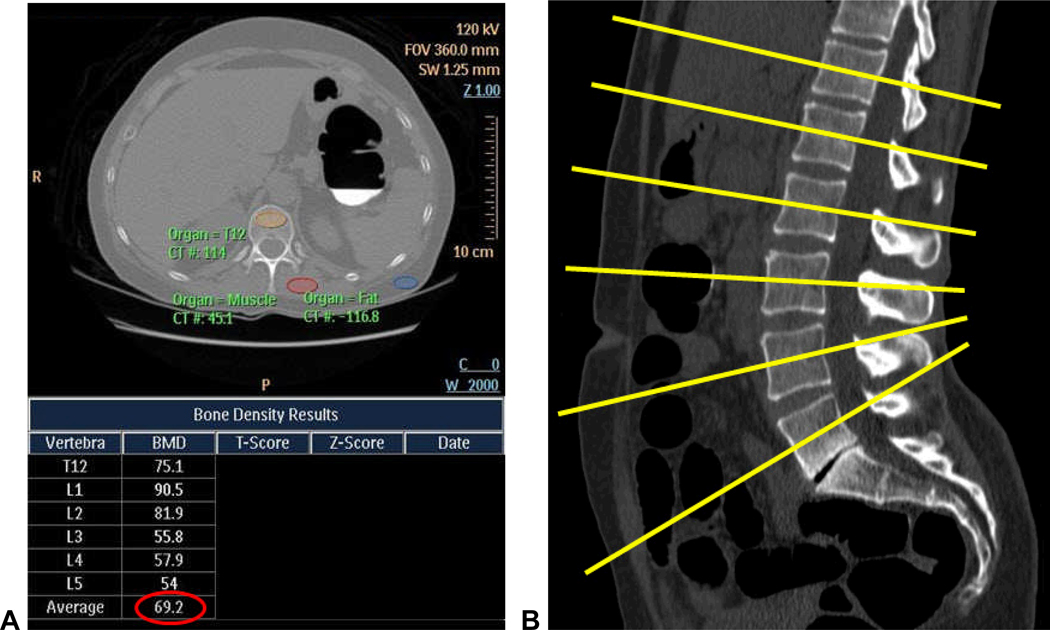
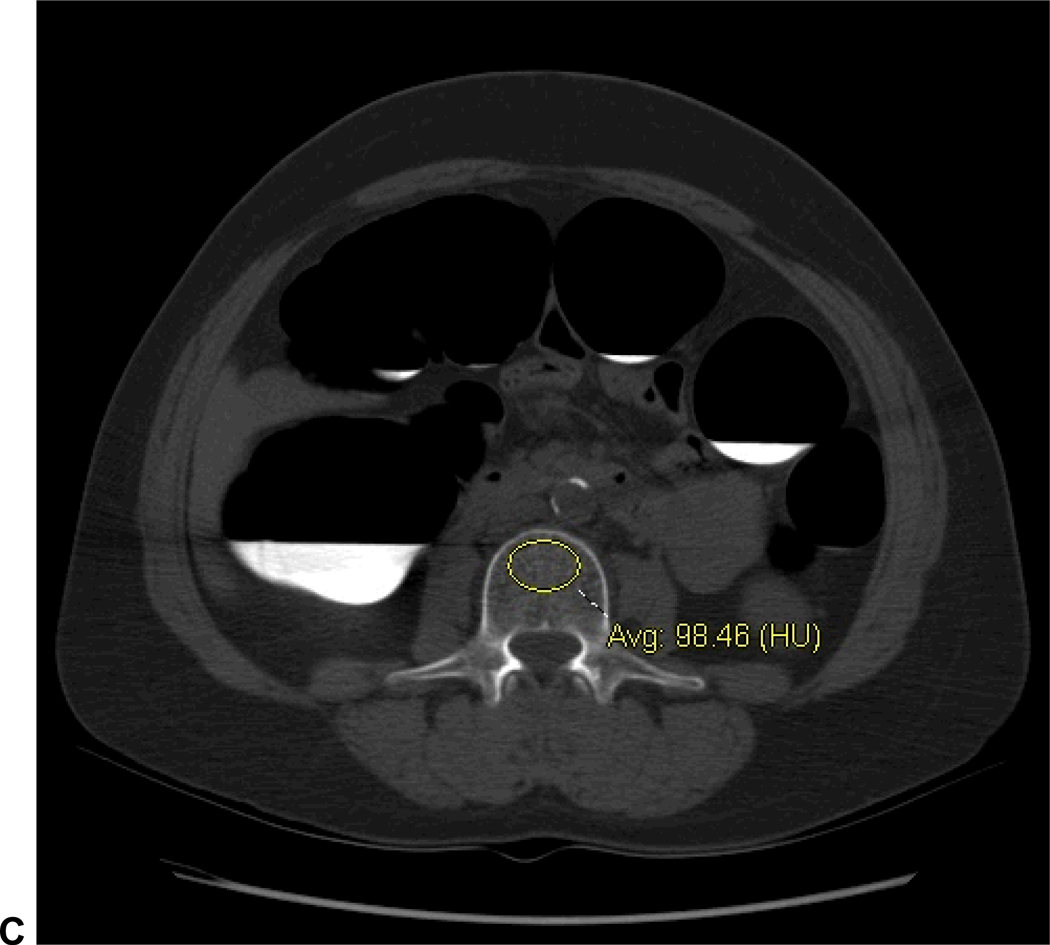
Figure 1. MDCT-based techniques for assessing bone mineral density at CTC screening.
A and B. Phantomless QCT technique: screen capture (A) of the phantomless QCT program and output shows the method of ROI placement for the vertebral body, muscle, and fat, shown here for the T12 level, which is then repeated for the L1–L5 levels. Each plane of measurement (B, yellow lines) is angled to be parallel with the end plates at that level. Note that the QCT-derived T-scores (and Z-scores) are blacked out and were not used in this study.
C. Simple ROI technique: standard transverse CTC image (same patient as in A) without oblique angulation shows ROI placement at the L3 level. Unlike QCT assessment, a single ROI placement at an individual level was considered as a primary outcome measure with this “simple” technique.
Note: images A and C are from a patient diagnosed with osteoporosis on DXA performed 4 days before CTC (L-spine T-score=−2.8). The QCT value of 69.2 mg/cc (circled in red) and the L3 vertebral attenuation of 98.5 HU are well below the thresholds derived in this study (see Table 1).


