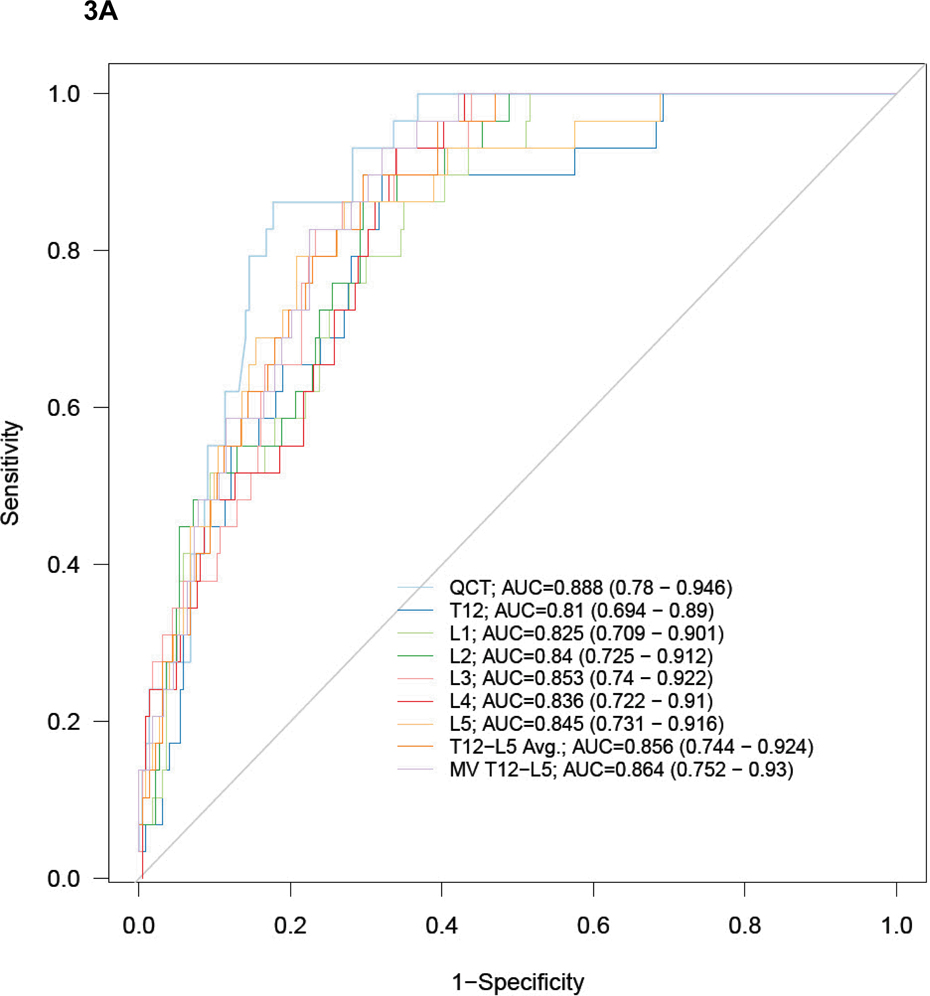
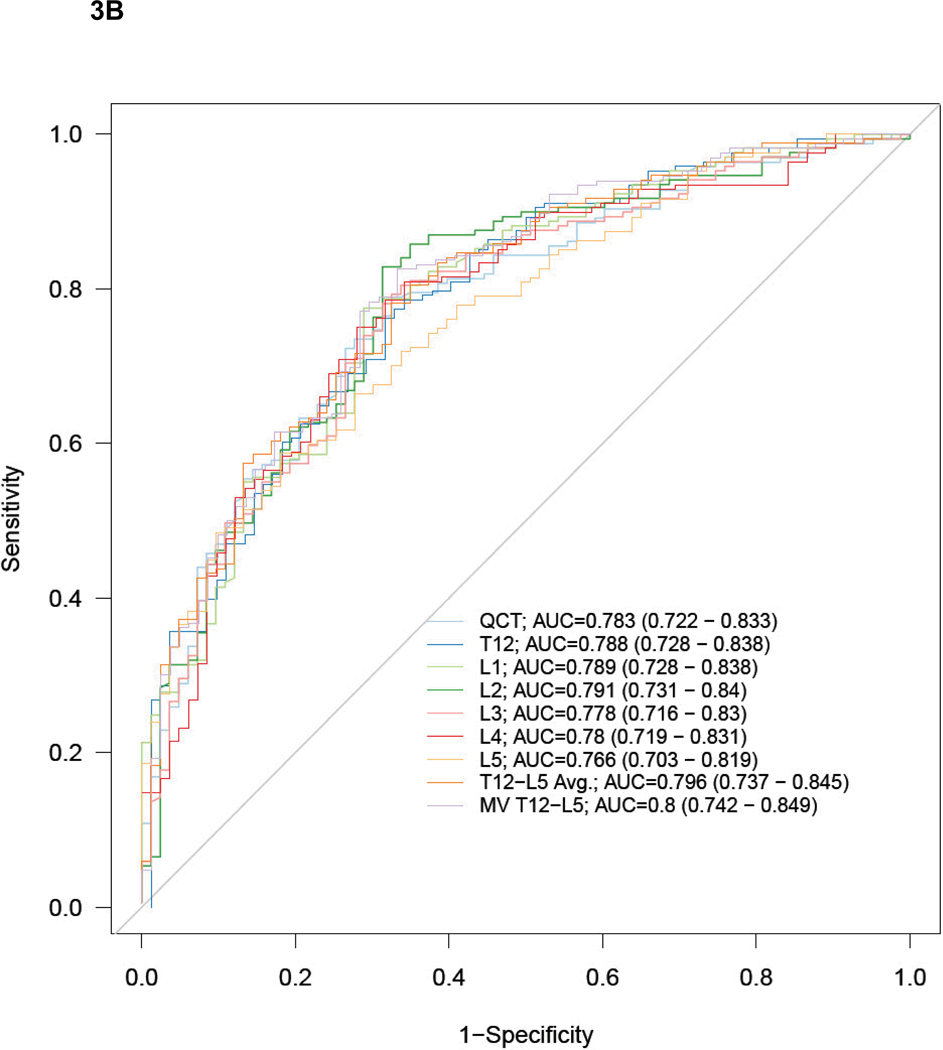
Figure 3. ROC curves for predicting DXA T-scores for osteopenia/osteoporosis with MDCT attenuation techniques.
ROC curves for phantomless QCT and simple ROI MDCT methods for detecting DXA T-scores of −2.5 or lower (A, osteoporosis) and −1.0 or lower (B, low BMD – osteopenia and osteoporosis). AUC values (with 95% CI) are shown for each method and level (MV = best multivariate model). Note how similar the performance is, regardless of specific ROI approach, with sizable overlap of all 95% confidence intervals.


