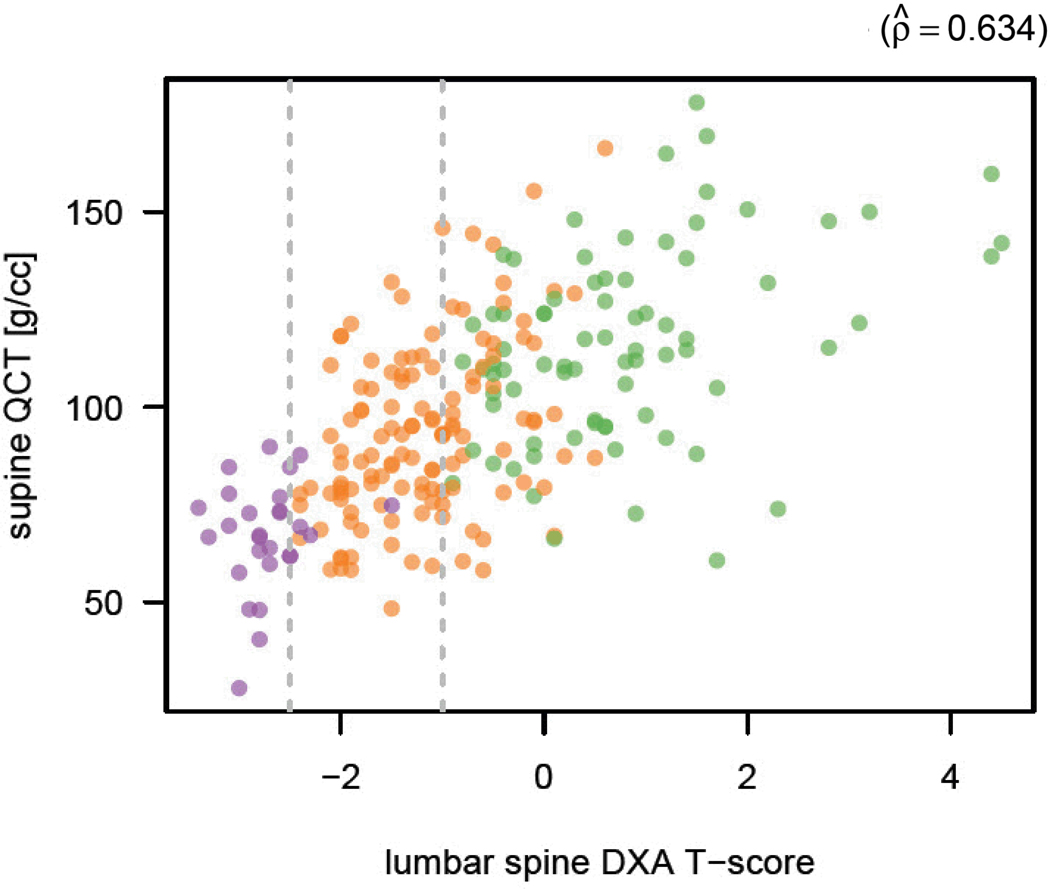
Figure 4. Scatterplot of BMD results at QCT compared with L-spine DXA T-scores.
Simple scatterplot shows BMD at QCT against L-spine DXA T-score. Patients with osteoporosis, osteopenia, and normal BMD according to central DXA T-score are depicted in purple, orange, and green, respectively. The Pearson product-moment correlation is 0.634.

