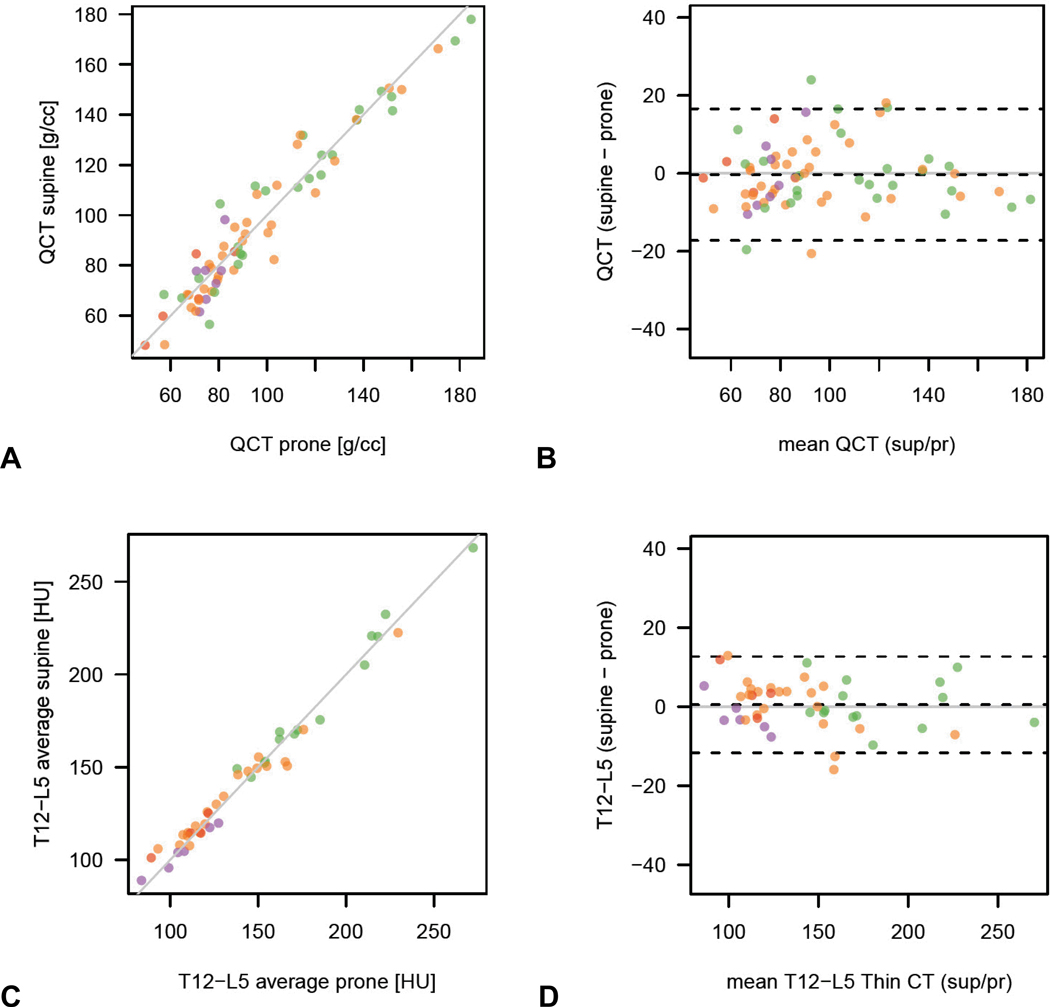
Figure 5. Reproducibility of MDCT attenuation techniques using supine and prone series as internal controls.
Simple and Bland-Altman plots for the phantomless QCT technique (A and B) and the simple ROI technique (C and D) in 45 patients who underwent DXA and CTC within 7 days of each other show slightly better reproducibility for the simple ROI vertebral method. (Note: purple dots = osteoporosis, orange dots = osteopenia, and green dots = normal BMD at DXA according to T-scores).

