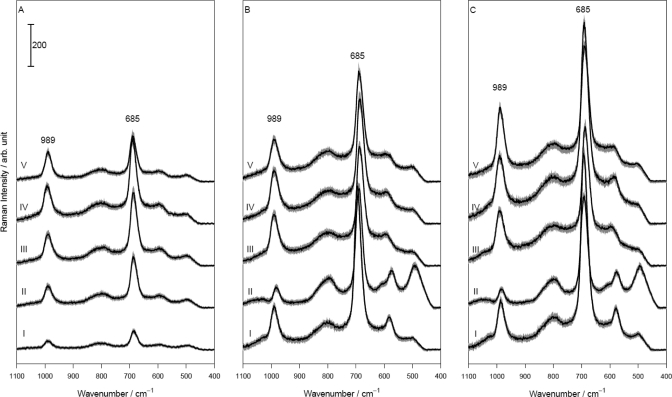
Figure 3.
(A) Mean Raman spectra of pure melamine solution c = 1 × 10⁻² M (I) and of melamine solution with KF (II), KCl (III), KBr (IV), and K2SO4 (V). (B) Nonactivated SER spectra of melamine c = 5 × 10⁻³ M with Pt29 (I), Pd90 (II), Ag70 (III), Au5 (IV), and AuAg12 (V). (C) Activated SER spectra of melamine with Pt107 + KCl (I), Pd90 + KCl (II), Ag23 + KCl (III), Au120 + KBr (IV), and AuAg12 + K2SO4 (V). Spectra shifted on the ordinate about 200 counts from each other; gray area around the spectra represents the standard deviation.

