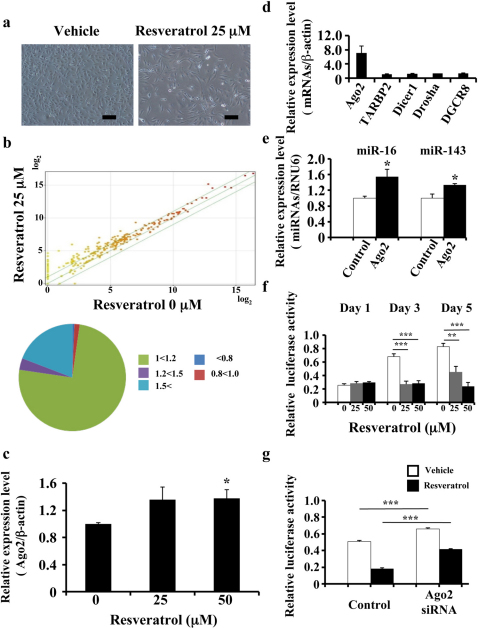
Figure 2. Association between resveratrol and Ago2.
(a) Characteristic microscopic images of MDA-MB231-luc-D3H2LN cells in the presence of DMSO (control) or resveratrol. Scale bar: 100 μm. (b) The effects of resveratrol treatment on miRNA expression in MDA-MB231-luc-D3H2LN cells by miRNA microarray analysis. The proportions of miRNAs at different fold change levels are shown in the lower panel. (c) MDA-MB231-luc-D3H2LN cells were treated with resveratrol or DMSO (control). After 2 days of culture, the cell extract was subjected to real-time mRNA qRT-PCR. (d), (e) MDA-MB231-luc-D3H2LN cells were grown and transiently transfected with Ago2 or EGFP-IRES vector (control). After 2 days of culture, the cell extract was subjected to real-time mRNA (d) and miRNA (e) qRT-PCR. The values on the y-axis are depicted relative to the expression level of the EGFP-IRES control vector, which is defined as 1. (f) MDA-MB231-luc-D3H2LN cells were grown and transiently transfected with luciferase siRNA or AllStars negative control siRNA (0.1 nM) under resveratrol treatment. After 1, 3, or 5 days of culture, the cells were subjected to a luciferase reporter assay. The values on the y-axis are depicted relative to the luciferase activity of the AllStars Negative Control siRNA, which is defined as 1. (g) MDA-MB231-luc-D3H2LN cells were grown and transiently transfected with luciferase siRNA or AllStars Negative Control siRNA and Ago2 siRNA or AllStars Negative Control siRNA. After 3 days of culture, the cells were subjected to a luciferase reporter assay. The values on the y-axis are depicted relative to the luciferase activity of the negative control siRNA, which is defined as 1 (all data are shown as the mean ± s.e.m., *P<0.05, **P<0.01, ***P<0.001).

