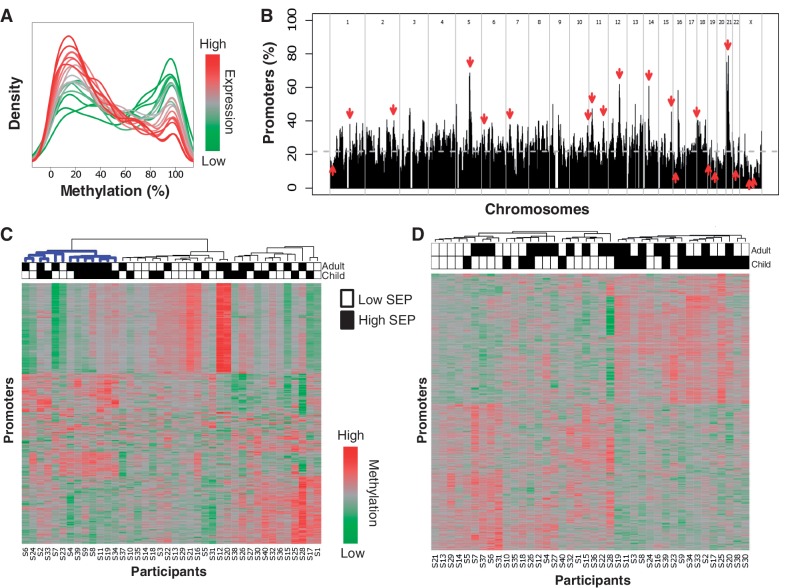
Figure 1.
Whole-blood promoter methylation in a variable SEP population. (A) Distributions of promoter methylation levels by published expression level. Genes are divided into 20 levels by whole-blood expression percentiles (0–5, 5–10, … , 95–100) based on publicly available expression data.50 Shown are the distributions of methylation levels for each expression percentile. The distributions show that genes with low or no expression (represented in green) tend to have highly methylated promoters, whereas genes with high expression (represented in red) tend to have little or no promoter methylation. (B) Distribution of variably methylated promoters. Distribution of variably methylated promoters across the genome shown as percentage of promoters in each region. Downward pointing arrows indicate regions enriched with variably methylated promoters, and upward pointing arrows indicate regions with little variability (FDR < 0.05). The dashed grey line shows the expected percentage of variably methylated promoters. (C) Most variably methylated promoters. Heatmap showing methylation scores of the 500 most variably methylated promoters (rows) across all 40 individuals (columns). Each promoter is represented by its most variable probe. Blackened squares above the columns denote high SEP in childhood or adulthood. The cluster highlighted in blue contains a significant number of high childhood and adulthood SEP individuals (hypergeometric; P ≤ 0.009). Each probe represents a distinct promoter (i.e. for promoters with multiple highly variable probes, only the most variable was included). (D) Differentially methylated promoters associated with childhood SEP. The heatmap shows the methylation scores of the 500 probes most significantly associated with childhood SEP with the following qualifications: each probe satisfied the individual requirements to be called differentially methylated, each belonged to a promoter called differentially methylated, and no pair of probes belonged to the same promoter

