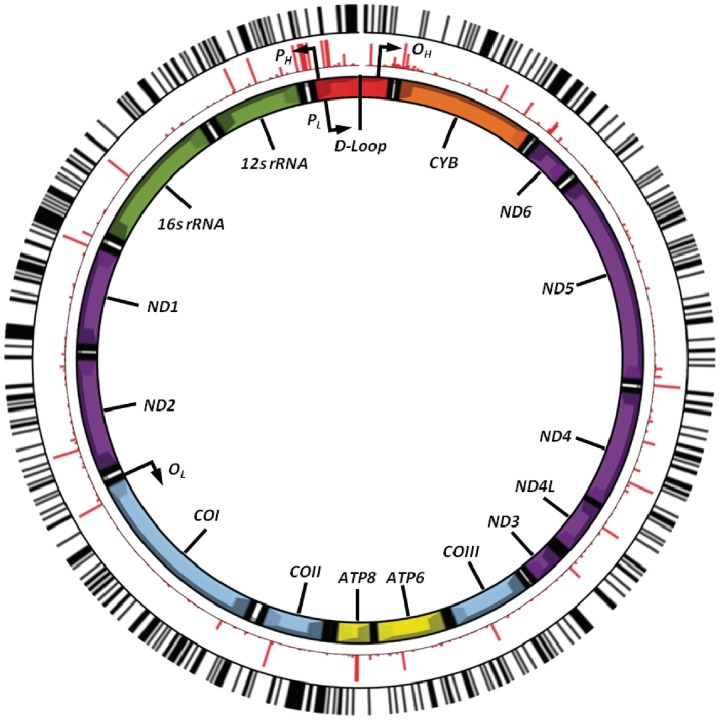
Figure 3.
The location of CpG sites in the mitochondrial genome relative to mitochondrial haplogroup defining polymorphisms. The image shows the mitochondrial genome (centre), showing the position and relative size of each of the 13 major mitochondrial genes, the origins of heavy-strand and light-strand replication (OH and OL, respectively) as well as both the light-strand and heavy-strand promoter sites (PL and PH, respectively). Shown in the middle (in red) are the relative frequencies and positions of 3358 mtDNA variants (MAF = 0.01–49.6% of 2147 full European mtDNA sequences). The outer ring (in black) shows the relative position of each of the 435 predicted CpG sites

