
Figure 2.
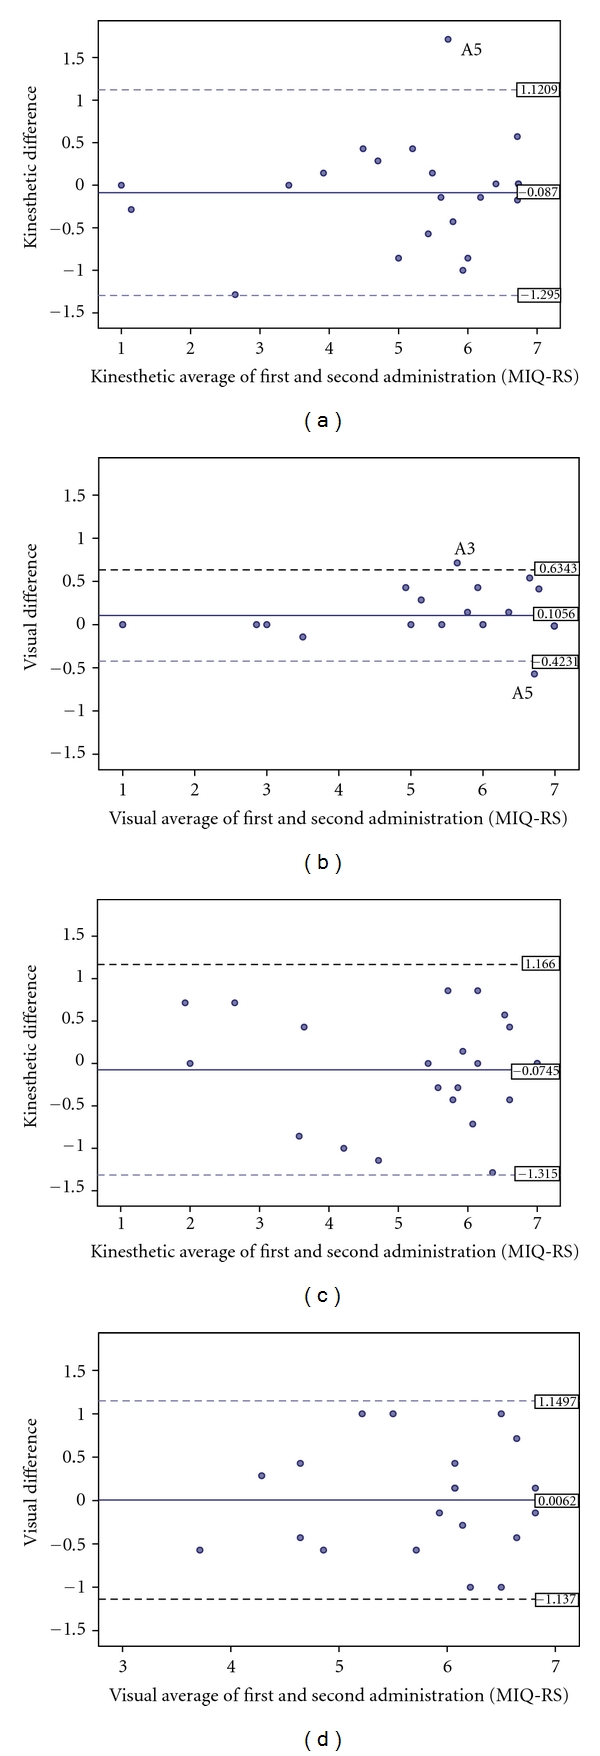
Bland-Altman plots illustrating the agreement of kinesthetic and visual scores of the MIQ-RS between sessions for individual participants. (a) kinesthetic agreement in the able-bodied group; (b) Visual agreement in the able-bodied group; (c) kinesthetic agreement in the stroke group; (d) Visual agreement in the stroke group. Horizontal lines are drawn at the mean difference, and at the limits of agreement, which are defined as the mean difference plus and minus 1.96 times the standard deviation of the differences.