
Figure 5.
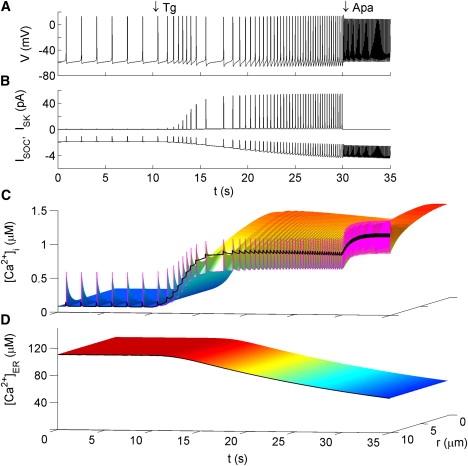
Model response to Tg and apamin. Tg is modeled by exponentially reducing the value of the SERCA pump rate νe from 1.3 μm μM ms−1 to zero with τ = 1.2 s using the expression for x(t) given in the Fig. 4 caption. Apamin is modeled by setting gSK to zero. Figure formatting is the same as in Fig. 4.