
Figure 6.
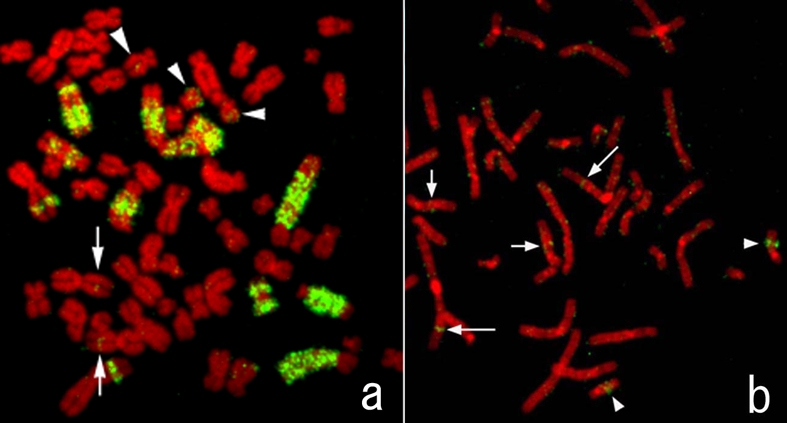
FISH image obtained using the probe generated by microdissection of an hsr of HS-RMS-2. a. A metaphase of HS-RMS-2. Note that green FISH signals are seen on large regions of some chromosomes, which are presumably hsrs. b. A metaphase spread from a normal lymphocyte. Long arrows (1p), short arrows (12q), and arrowheads (18q) show native locations of the DNA derived from the micro-dissected amplification regions.