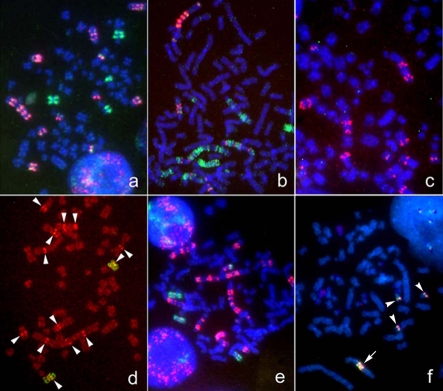
Figure 7.
Gene amplification demonstrated by FISH using commercially available onco-gene probes. a. JUN (1p31) (red) and chromosomes 1 painting (green); b. MYC (8q24.12-13) (red) and chromosome 8 painting (green); c. CCND1 (11q13) (red); d. INT2 (11q13.3) (red) and chromosome 11 painting (green). Arrowheads show the red FISH signals of the original location on green painted chromosomes 11 and spotted red ones of INT2; e. MDM2 (12q14.3-q15) (red) and chromosome 12 painting (green); f. MALT (18q21) (reddish-white). The probe represents proximal (green; 345 kb) and distal (red; 680 kb) regions of the MALT gene. An arrow shows the marker chromosome with amplified signals. Arrowheads show a single copy gene on each chromosome.

