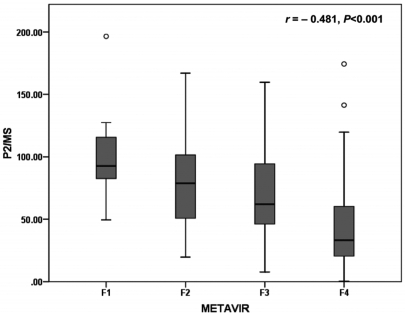
Figure 1.
Box plot of P2/MS according to the fibrosis stage by the METAVIR scoring system.24 Boxes represent interquartile ranges, whiskers indicate highest and lowest values, circles represent outliers, and horizontal lines within boxes indicate median values. P2/MS values showed a significant inverse Spearman's correlation according to the METAVIR fibrosis score.
P2/MS, [platelet count (109/L)]2/[monocyte fraction (%)×segmented neutrophil fraction (%)].

