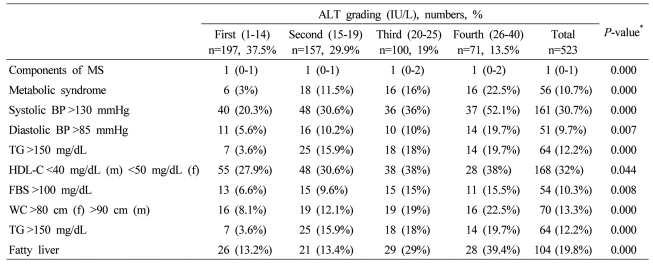
Table 5.
Components of MS, fatty liver, and severity of fatty liver according to serum ALT grading in female subjects
Data are expressed as medians (interquartile ranges) for skewed variables, or proportions for categorical variables. Differences were assessed using the Kruskal-Wallis H test for continuous variables or the chi-square tests for categorical variables.
*Tested by the Spearman's rank correlation analysis.
MS, metabolic syndrome; WC, waist circumference; TG, triglyceride; FBS, fasting blood glucose; HDL-C, HDL cholesterol.

