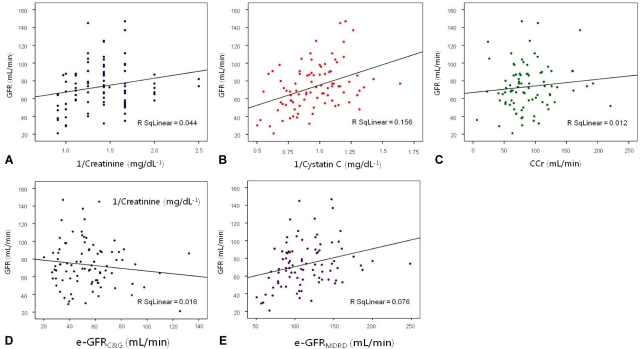
Figure 1.
Scatter plots of glomerular filtration rate (GFR) versus serum creatinine (A) and cystatin C (B) levels, creatinine clearance (C), e-GFRC&G (D), and e-GFRMDRD (E).
CCr, creatinine clearance; e-GFRC&G, glomerular filtration rate as estimated using the formula of Cockcroft and Gault; e-GFRMDRD, glomerular filtration rate as estimated using the modification of diet in renal disease equation.

