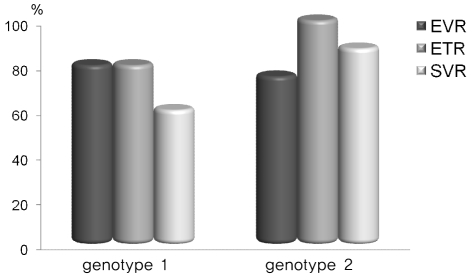
Figure 1.
Treatment responses according to HCV genotype. In genotype 1 (n=10), the rates of EVR (early virologic response), ETR (end of treatment response), and SVR (sustained virologic response) were 80%, 80%, and 60%, respectively; the corresponding rates in genotype 2 (n=8), were 75%, 100%, and 87.5%.

