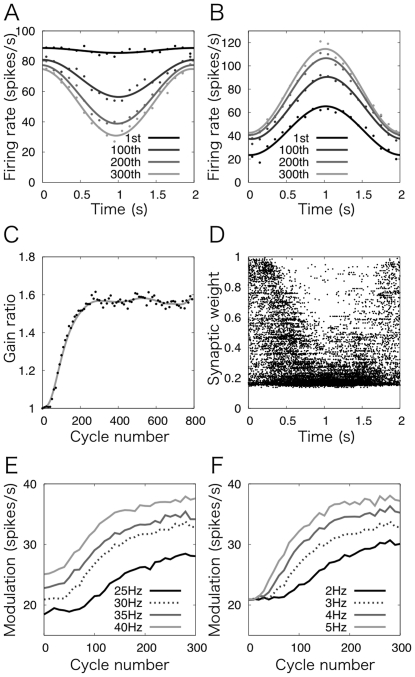
Figure 3. Simulation of OKR adaptation.
(A and B) Learning-induced change of the firing of (A) a Purkinje cell and (B) a VN neuron at the 1st, 100th, 200th, and 300th cycles of MF signal oscillation (black to gray, respectively). The Purkinje cell increases the modulation from 3 to 24 spikes/s by decreasing the minimum firing frequency from 83 to 27 spikes/s. The maximal firing frequency changes modelately (from 89 to 75 spikes/s). The VN neuron increases the modulation from 21 to 33 spikes/s by increasing the maximal firing frequency from 63 to 121 spikes/s. The minimal firing frequency changes from 22 to 41 spikes/s. (C) Gain change with respect to the number of cycles. Gain ratio was defined by the modulation of a VN neuron at each 10 cycles divided by the modulation at the 1st cycle. The gain ratio gradually increases and converges to 1.57 by 300 cycles. (D) The distribution of synaptic weights between active granule cells and Purkinje cells after 300 cycles of MF signal oscillation. The synaptic weights of active granule cells at the beginning and end of a cycle are uniformly distributed between 0.15 and 1, whereas these around the middle of a cycle are narrowly distributed between 0.15 and 0.5. Thus, the temporal change is reversely correlated with the waveform of the CF signal as in Figure 1B. (E and F) Modulation of a VN neuron by 300 cycles of MF signal oscillation with different peak firing rates of (E) MFs at 25, 30, 35 and 40 spikes/s while setting that of CFs at 3 spikes/s, and (F) CFs at 2, 3, 4 and 5 spikes/s while setting that of MFs at 30 spikes/s (black to gray). In both cases, the modulation increases as their peak firing rates increase.

