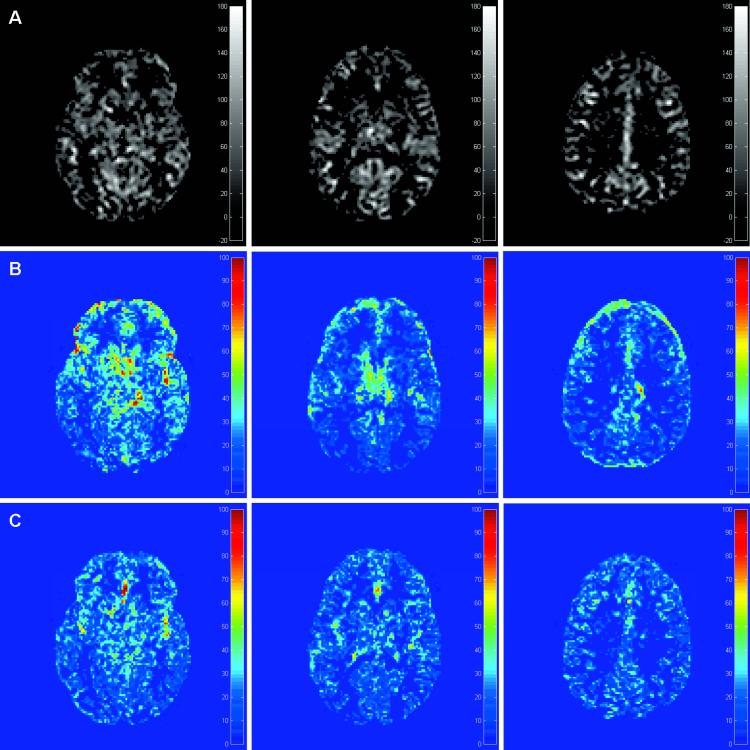
Figure 6.
Standard deviation maps obtained with repeatability study. Top row (A) shows the segmented GM CBF map for three slices while (B) shows the σ map across four repeated scans with 3D-PULSAR and (C) shows the σ map with IR-3D-PULSAR. Notice the poorer reproducibility of perfusion signal in areas close to CSF with 3D-PULSAR due to increased background noise.

