Figure 10.
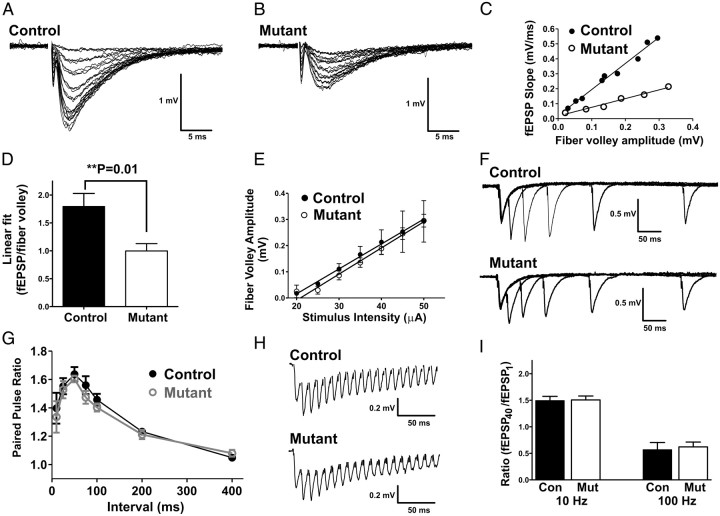
Reduced excitatory synaptic transmission in the mutant hippocampus. Recordings of fEPSPs in CA1 from control (A) and mutant (B) mice. Traces of field potential responses to increasing evoked stimulus intensity by 5 μA every three sweeps; range, 20–50 μA. C, The linear fit of the fEPSP rise slope (millivolts per milliseconds) to fiber volley amplitude (millivolts) plot demonstrates reduced synaptic strength in mutant mice; the data in the histogram plot in D is the average across multiple animals (n = 5) and shows that synaptic strength in mutant animals (slope, 1.0 ± 0.1) is significantly reduced compared with control (slope, 1.8 ± 0.2). E, Fiber volley amplitudes evoked by a range of stimulus intensities were not different between control and mutant. Paired-pulse responses of fEPSPs (F, G) in control and mutant were measured at intervals of 10, 25, 50, 75, 100, 200, and 400 ms and were not statistically different. H, Examples of traces of fEPSP responses to 40 stimuli pulses delivered at 100 Hz. I, Summary histogram of fEPSP responses to 40 stimuli pulses delivered at 10 or 100 Hz. The ratios of the fEPSP rise slope of the 40th pulse to the first pulse were not significantly different between control and mutant at either frequency.

