
Figure 8.
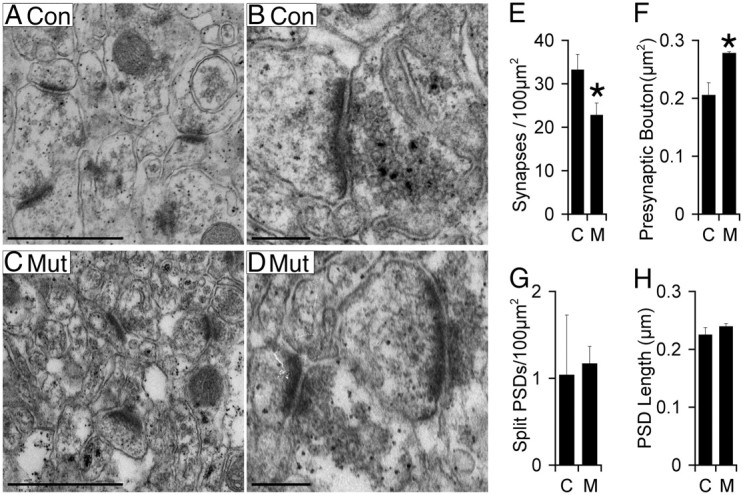
Reduced synapse density in CA1–SR in the afadin mutant. A–D, Images of synapses in control (A, C) and mutant (B, D). Scale bars: A, C, 1 μm; B, D, 0.25 μm. E–H, Significant reduction in synapse density (E) in mutant (M) versus control (C). In addition, presynaptic bouton area (F) is significantly increased in mutant (M) versus control (C). No significant differences between control and mutant were seen in the density of split PSDs (G) or average length of the PSD (H). Error bars depict SD. *p < 0.05, n = 3.