Figure 9.
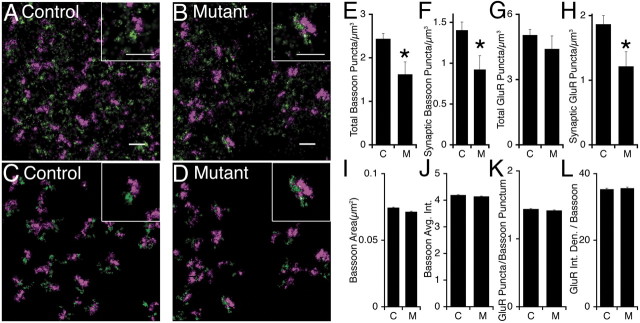
STORM demonstrates loss of synapses in mutants. A, B, Original high-resolution STORM image from a control (A) and mutant (B) showing puncta of bassoon (purple) and glutamate receptor 1/2 (green). Scale bar, 1 μm. C, D, STORM image from a control (C) and mutant (D) masked to show only the apposed bassoon and AMPA glutamate receptor 1/2 puncta. E–H, Average puncta density is significantly reduced in mutants (M) versus controls (C) for all bassoon puncta (E), bassoon puncta apposed to a glutamate receptor puncta (F), and glutamate receptor puncta apposed to a bassoon puncta (G). There was not a statistically significant reduction in total AMPA glutamate receptor (GluR1/2) puncta (H) (p = 0.19). n = 6 control, 7 mutant. Error bars are SEM. *p < 0.005. I–K, Unlike puncta density, controls and mutants had changes <5% in average synaptic bassoon size (I), average synaptic bassoon intensity (J), average number of glutamate receptor puncta per bassoon punctum (K), and average total glutamate receptor integrated density per bassoon punctum (L). n > 8500 puncta per genotype. Error bars are SEM.

