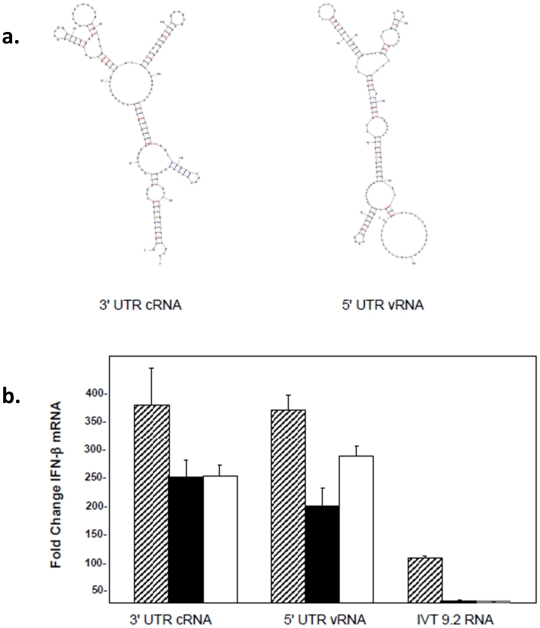
Figure 3. Induction of IFN-β message is triphosphate independent.
(A) The secondary structures of the IVT-RNAs shown were predicted by the program mfold (v3.2). (B) A549 cells were transfected with 3 µg of UTR RNA from the 3′ end of the cRNA or 5′ end of the vRNA and RNA was isolated 24 hr post-transfection to determine IFN-β levels by qRT-PCR. The data are shown as fold increases over levels in mock transfected cells. Error bars represent the standard deviation of triplicate qRT-PCR runs using RNAs from one of three representative experiments. Hatched bar, filled bar and empty bars represent untreated, CIP-treated and capped RNAs.

