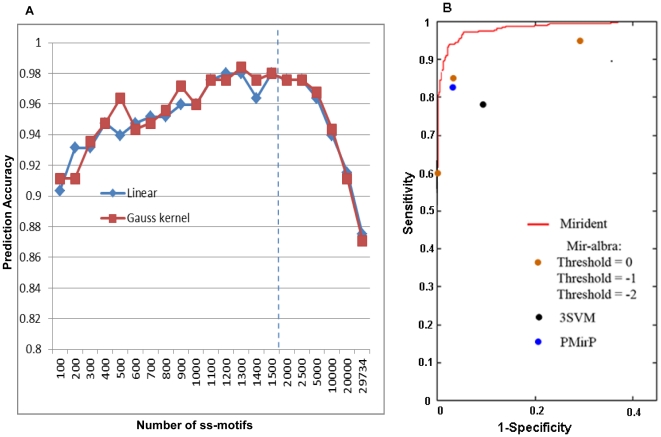
Figure 2. Mirident performance.
A. Effect of increasing number of ss-motifs on miRNA prediction accurracy. Note: The X-axis is discontinuous above 1500 motifs (dashed line). B. The ROC curve of Mirident (red line) trained with 1300 ss-motifs. The Area Under Curve (AUC) is 0.99. Results for other methods are shown for comparison.

