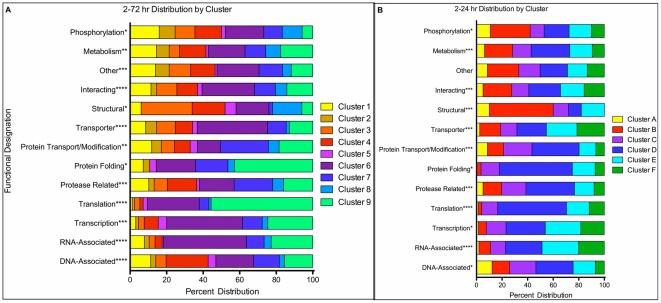
Figure 6. C. parvum Transcriptome 2–24 hr Relative Expression Cluster Analysis.
The DIANA algorithm was used to cluster each gene's relative expression using the absolute cosign distance metric. For the heatmap each gene is represented in one row and each column represents the percent expression at one time point. (A)The relative expression (%) was determined for each gene's median normalized value over the first 24 hr of the time course, which includes 4 time points (3297 genes). Six clusters (A–F) of genes are present with a dendrogram distance cutoff of 1, as depicted with the color bar to the right of the heatmap. (B) The average gene expression per cluster (+/− SD) using the first 4 time points (24 hr) is plotted with the number of genes found in each cluster within the ().

