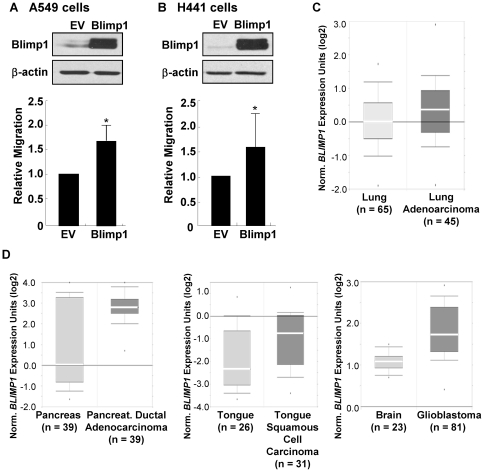
Figure 2. Blimp1 promotes lung cancer cell migration and is aberrantly expressed in multiple cancers.
(A) A549 cells or (B) H441 cells were transiently transfected with 1 µg of Blimp1 cDNA or EV DNA using Lipofectamine 2000. Upper panels: WCE were isolated after 48 h and subjected to immunoblot analysis for Blimp1 and β-actin. Lower panels: Alternatively, 24 h after transfection, cells were subjected to a migration assay as in Fig. 1. The average migration from three independent experiments ± SD is presented relative to the EV (set at 1.0). P values were calculated using a Student's t-test. *, P<0.005. C) Box plot from the Hou lung cancer microarray dataset was accessed using Oncomine Database. Student's t-test for the two groups shows a P value of 0.024. D) Box plots from the Badea pancreatic cancer, Estilo head-neck cancer and Sun brain tumor microarray datasets were accessed using Oncomine Database. Student's t-tests comparing the groups in these studies show P values of 8.67e−7, 0.001 and 3.28e−15, respectively.

