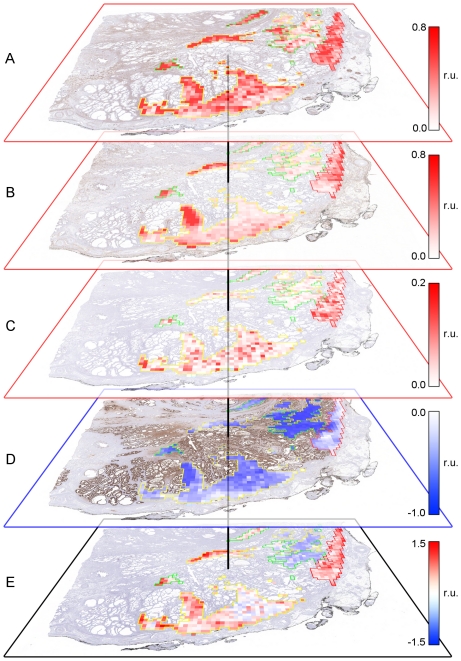
Figure 6. Generation of an IHC Signature Map.
Displayed values of the IHC maps and IHC signature maps are in relative units (r. u.). (A) IHC Map for ENO2, shown in red since the weighting factor was positively signed (higher expression is associated with aggressive disease) and thus higher expression was shown as more intense red. (B) IHC Map for CD34 (also shown in red due to positively signed weighting factor). (C) IHC Map for MKI67 (also shown in red due to positively signed weighing factor). (D) IHC Map for ACPP, shown in blue since the weighting factor was negatively signed (higher expression is associated with non-aggressive disease) and thus higher expression was shown as more intense blue. (E) The weighted sum of IHC Scores (termed an IHC Signature Map) were projected in grid squares across annotated tumor areas of Gleason scores 3+3, 3+4, and 4+3 outlined in green, yellow and red, respectively.

