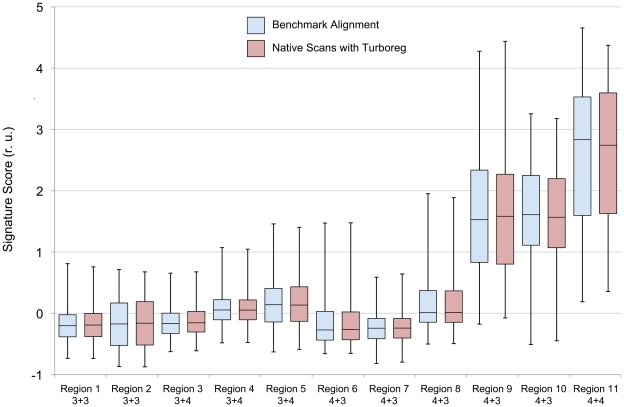
Figure 9. IHC signature scores from 11 annotated regions of cancer from 10 subjects.
The benchmark (blue) and native (red) data for the same region are shown immediately adjacent to each other for comparison. For each region, the minimum, 1st quartile, median, 3rd quartile and the maximum values are shown. The data are sorted first by grade and then by the median of the benchmark data within each grade.

