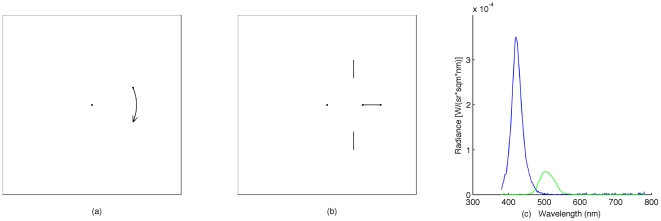
Figure 1. Schematic illustration of the stimuli used in the experiments.
(a) Motion detection task. A dot appears on the left or the right side of the fixation point (FP) at a given eccentricity and revolves around the fixation for 100 ms. (b) Movement localization task. A dot moves from the left or the right towards the fixation point (motion-terminated condition) or moves away from fixation to the left or the right side (motion-initiated condition). (c). Spectral charts for the blue filter (blue curve) and the green filter (green curve). The scotopic luminance for the blue and the green was approximately 3.93 cd/m2 (used for the fixation and reference bars) calculated with the scotopic luminosity function (CIE 1951).

