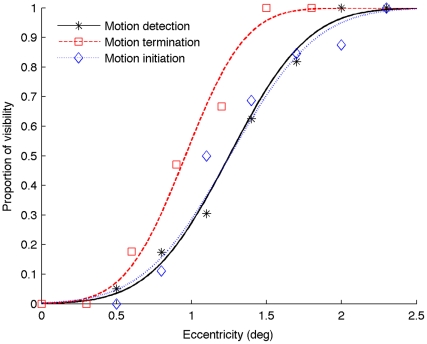
Figure 2. Psychometric curves for a typical participant from Experiment 1.
The black solid curve (with stars) represents the proportion the revolving dot is detectable at given eccentricity. The red dashed curve (with squares) represents the proportion the moving dot is seen at given eccentricity in the motion-terminated condition. The blue dotted curve (with diamonds) denotes the proportion the moving dot is seen at given eccentricity in the motion-initiated condition.

