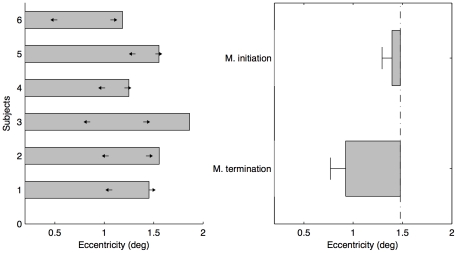
Figure 3. Results of Experiment 1.
(a) Individual thresholds of participants for three conditions. The left arrows denote the perceived vanishing positions in the motion-terminated condition; the right arrows denote the perceived initial positions in the motion-initiated condition; the gray bars denote the thresholds (50%) of motion visibility at 0.028 cd/m2. (b) Mean forward shifts in the motion-initiated and motion-terminated conditions (±SE, n = 6). The vertical dot-dashed line denotes the mean radius of the relatively insensitive fovea centralis.

