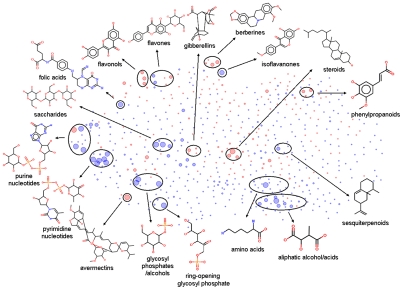
Figure 3. Structural cluster map of anaerobic and aerobic metabolites (represented with blue dots and red dots, respectively).
In this map, the distance of two compounds is determined by their Tanimoto similarity (based on shared substructural fragments). Similar compounds are pooled together into clusters. The dot size indicates the number of the clustered compounds (with Tanimoto similarity >0.85). The largest dots represent clusters containing more than 10 similar compounds. Some representative compounds for the major clusters are presented around the map.

