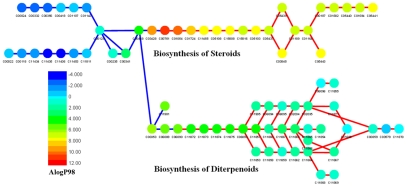
Figure 7. Polarity variation trends in pathways for biosynthesis of steroids and diterpenoids.
Each metabolite is represented with a dot. Blue lines connect anaerobic metabolites (left) and red lines connect aerobic metabolites (right). The metabolite polarity descriptor (AlogP98) is indicated by different colors, from blue (strong polar) to red (strong non-polar). The polarity of metabolites decreases steadily to the minimum with the progression of anaerobic reactions (from left to right). In contrast, the polarity of aerobic metabolites increases with the expansion of aerobic networks but is on average still weaker than that of anaerobic metabolites.

