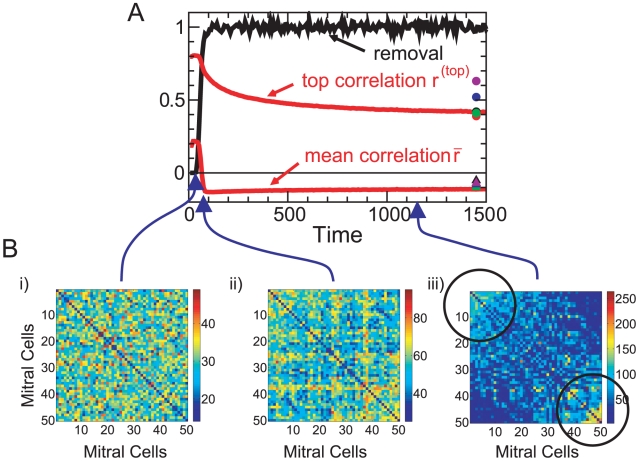
Figure 3. Decorrelation and connectivity.
Evolution of the pattern correlation and rate of granule cell removal (scaled by their influx) (A), and the effective connectivity matrix  between pairs of mitral cells (cf. Eq.(7)) (B). Initially (
 ) almost all granule cells survive, generating a random connectivity that does not decorrelate the stimuli (Bi). By
  the selective removal of weakly active granule cells leads to a structured connectivity (Bii) that reduces the mean correlation
  . The highly similar stimuli
  -limonene and
  -carvone are only decorrelated by strong inhibition between highly co-active mitral cells (marked by black circles), which emerges in the final steady state (Biii). Parameters for the simulation in A as in Fig. 2. The correlations have been averaged over 16 runs. The symbols at
  0 denote output correlations for different slopes of the survival curve,
  2.5,1 (cf. Fig. 1Bi). For visual clarity the connectivities are shown in B for a reduced network of 50 instead of 424 mitral cells (for parameters see Fig.S1B in Text S1). In the connectivity matrices the diagonal elements have been divided by 10.

