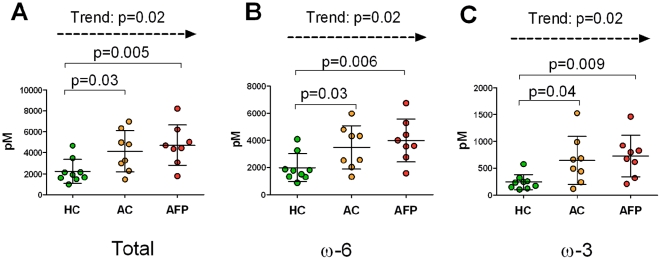
Figure 1. Sum of 15-LOX metabolites.
(A) Sum of 15-LOX metabolites from both ω-3 and ω-6 pathways. (B) Sum of 15-LOX metabolites from ω-6 fatty acids (12-and 15-HETE, 15-KETE, 5,15-DiHETE, 13-HODE, 9,10,13- and 9,12,13-TriHOME, 9-HODE, 9-KODE and 15-HETrE), (C) Sum of 15-LOX metabolites from ω-3 fatty acids (9- and 13-HOTE, 12- and 15-HEPE and 17-HDoHE). Data are provided as concentration in BALF (pM). HC: Healthy controls, AC: Asthmatic controls, AFP: Asthmatics following provocation. The p-values obtained using Student's T-test (HC vs. AC and HC vs. AFP) and one-sided Cochran-Armitage trend test (HC, AC and AFP) are indicated in the figure.

