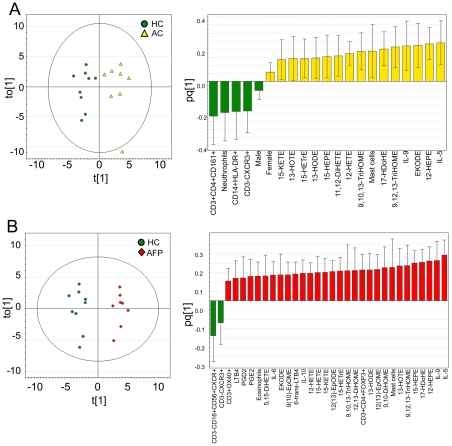
Figure 3. OPLS score and loading column plots with respect to separation according to diagnosis.
Loading column plots visualize variables correlating with healthy (−) or asthmatics (+), error bars indicate 95% confidence interval. The number of variables correlating with the asthmatic population with 95% confidence increases following provocation from n = 21 to n = 32. (A) Healthy controls (green) and asthmatic controls (yellow) (R2Y[cum] = 0.87, Q2[cum] = 0.51). (B) Healthy controls (green) and asthmatics following provocation (red) (R2Y[cum] = 0.95, Q2[cum] = 0.73).

