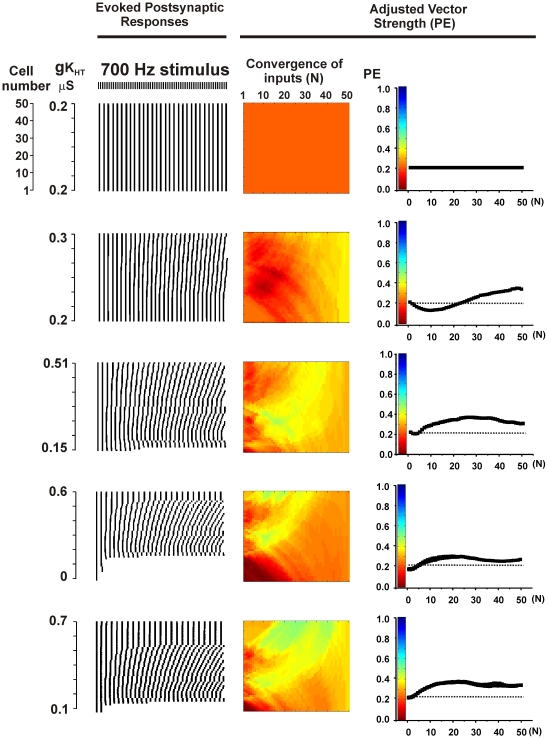
Figure 4. Gradients of KHT channels enhance vector strength PE of combined postsynaptic output.
Left panels show raster plots for the timing of the peaks of postsynaptic output of 50 individual neurons. Each peak that follows a stimulus pulse is represented as a short vertical line and these are aligned vertically for the 50 neurons in a linear ensemble. Center panels show a color-coded representation of the vector strength PE for linear combinations of the output from 1 to 50 of the neurons in the ensemble. Colors at the very left of the rectangle represent the value of PE for the outputs of the 50 individual neurons corresponding to the left panels. The color at the right edge of the rectangle represents PE for the combined postsynaptic output of all 50 neurons. Colors in the middle represent the values of PE for linear combinations of 2–49 neurons. Color code is shown in the right panels, which also plot the mean values of PE for linear convergence of the output of 1–50 neighboring presynaptic neurons. Top panels show results for an ensemble with no channel gradient, while the lower four sets of panels show results for the four gradients depicted in Fig. 3A (left panel).

