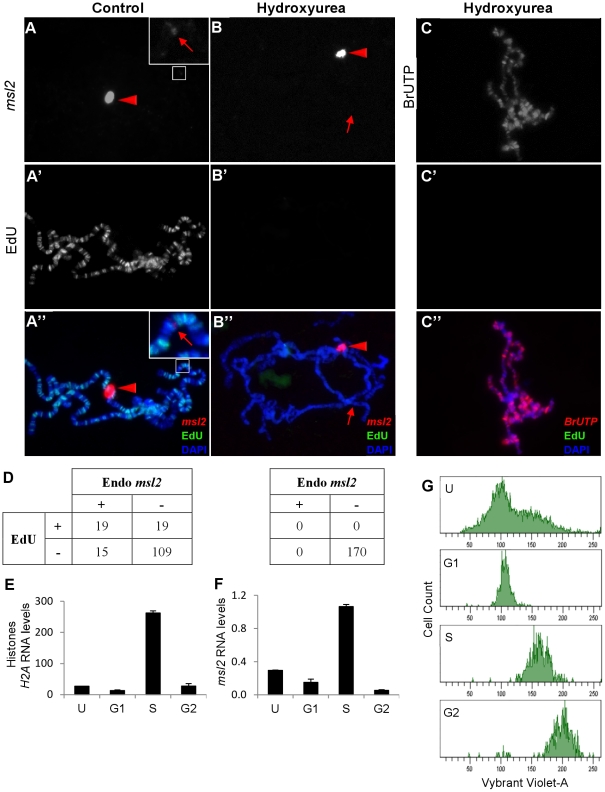
Figure 6. Transcription of msl2 is correlated with cell cycle.
Nascent msl2 transcripts were detected with antisense FISH riboprobe in salivary glands. (A) Transgenic H83M2 expression (bright signal indicated by red triangle) was observed at the 87A insertion site in all nuclei. Hybridization to the endogenous msl2 locus at 23F (faint band indicated by red arrow in inset) was seen in only a minority of nuclei. Because of the difference in signal intensities between the two msl2 loci, the inset is enhanced to show the weaker signal. (A′) EdU incorporation shows that this is one of the few nuclei undergoing endoreplication. (B) After treatment with 1 mM of HU (hydroxyurea), no cell transcribed the endogenous msl2 gene (red arrow) but the transcription of H83M2 continued (red triangle). (B′) HU blocked EdU incorporation from any cell. (C) Simultaneous treatment of salivary glands with HU, BrUTP, and EdU showed that blocking replication did not inhibit bulk transcription in these cells. (D) Many nuclei without (left table, N = 162) or with (right table, N = 170) HU treatment were scored for expression of endogenous msl2 and EdU incorporation. Nascent transcripts were detected at the H83M2 transgene in 100% of the nuclei (data not represented in the table). After sorting growing S2 cells into their respective phase of cell cycle via FACS, qPCR was done to quantify H2A (E) and msl2 (F) transcripts levels normalized to PKA. (G) The FACS profile of unsorted (U) and sorted S2 cells (G1, S and G2 cell cycle). The sorted cells have a slightly higher content of Vybrant Violet-A dye because the cells are collected into tubes containing Vybrant Violet-A. The Y-axes are drawn on different scales.

