
Figure 3.
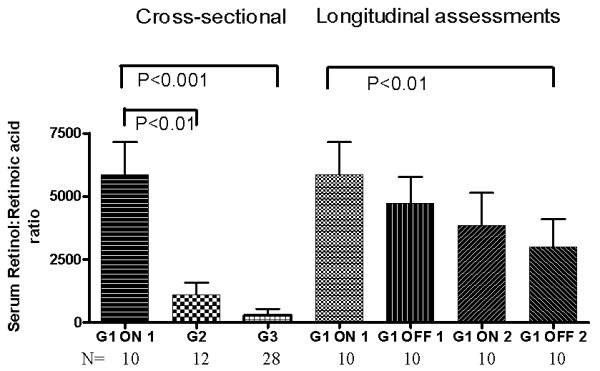
Serum retinol: retinoic acid ratio: cross-sectional and longitudinal assessments. Bars represent means and SEM. G1 = patients enrolled in the CTN-140 Trial: ON 1 = during cART intensification (long-term effect); OFF 1 = during first cART interruption; ON 2 = after first cART resumption when viral load was again below the detection limit (short-term effect); OFF 2 = during second cART interruption. G2 = HIV-infected persons with suboptimal virologic control (repeated detectable VL); G3 = healthy volunteers. P values for cross-sectional assessments are from the Kruskal-Wallis test, followed by Dunnett's post hoc test for multiple comparisons. P values for longitudinal assessments in G1 are from Friedman's test, followed by Dunnett's post hoc test for multiple comparisons.