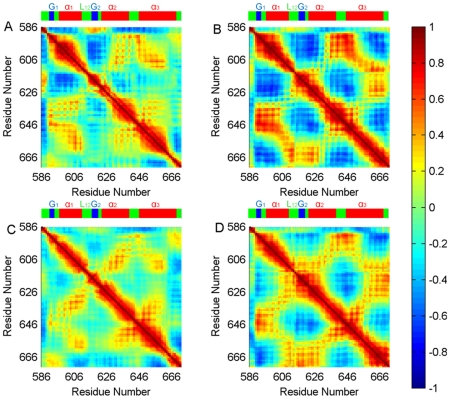
Figure 4. Cross correlations of fluctuations of KIX from different simulations.
The cross-correlation maps of KIX from the simulations of: (A) KIX-only, (B) KIX∶MLL, (C) c-Myb∶KIX, (D) c-Myb∶KIX∶MLL. The color scale is represented on the right ranging from red to blue: highly positive correlations are in red, highly negative correlations are in blue. Colors in between relate to the scale among these extremes. The numbers on the axes refer to residue positions. The figure illustrates the strong coupling between the Ala630- Ser642 region and the His592-Pro617 region; Lys606-Leu628 region with His651-Glu666. The cross-correlations of the motions between these regions imply that they play an important role in the propogation of the allosteric effect upon MLL binding to KIX. The color bar on the top of each map stands for the secondary structure (α-helix: Red, Loop: Green, 310-helix: Blue).

