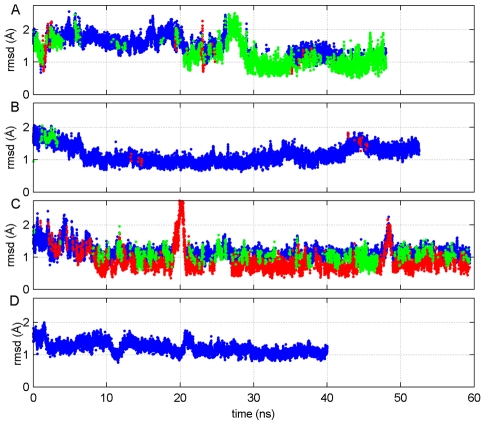
Figure 5. Combinatorial clustering of the KIX ensemble sampled in different simulations.
The combinatorial clustering of all KIX conformations sampled in the KIX-only (A), KIX∶MLL (B), c-Myb∶KIX (C) and c-Myb∶KIX∶MLL (D) simulations. Blue, green and red dots represent the members in different clusters. The clustering observed in the figure points to the redistribution of the KIX populations upon c-Myb binding (C). This is because the frequency of occurrence of the KIX conformations is similar to those that KIX has when in the c-Myb∶KIX∶MLL case (blue dots). However, it decreases as compared to KIX (A), KIX∶MLL (B) or the c-Myb∶KIX∶MLL (D) cases.

